
This patient, with an unremarkable background history, had several episodes of transient, anterograde amnesia with preserved consciousness and language abilities before a formal diagnosis of TEA was made. The initial diagnosis was difficult and…
Blog
-
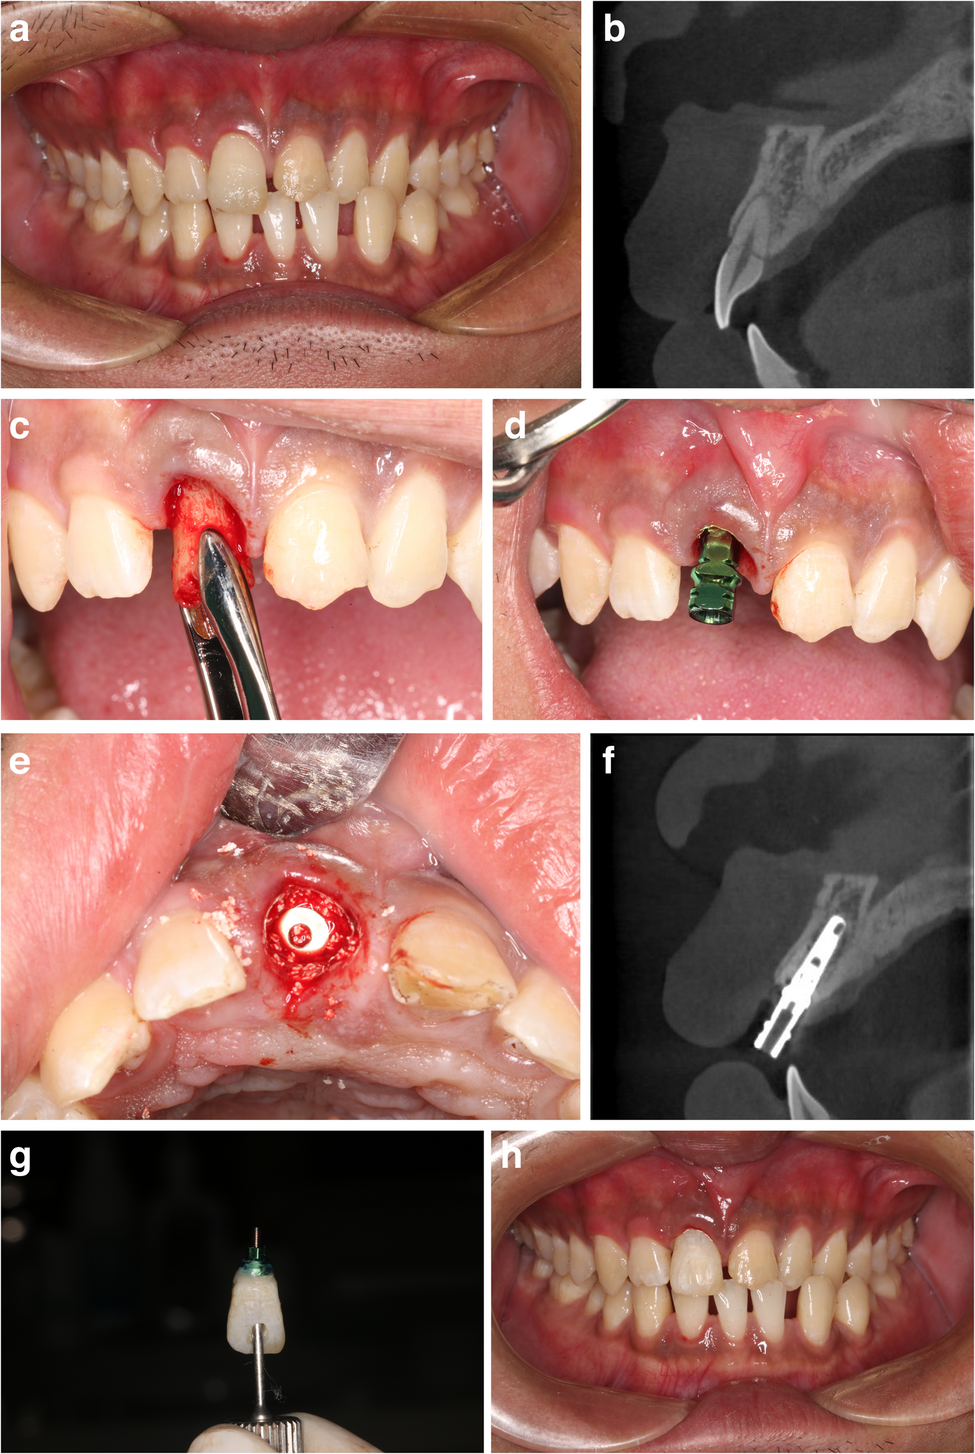
Immediate implant placement for single failed maxillary anterior teeth after trauma: a case-series study | BMC Oral Health
Patients and study design
A review of the medical records of individuals who underwent immediate placement of dental implants following injuries to their teeth was performed. During the period spanning from January 2014 to December 2021, patients…
Continue Reading
-
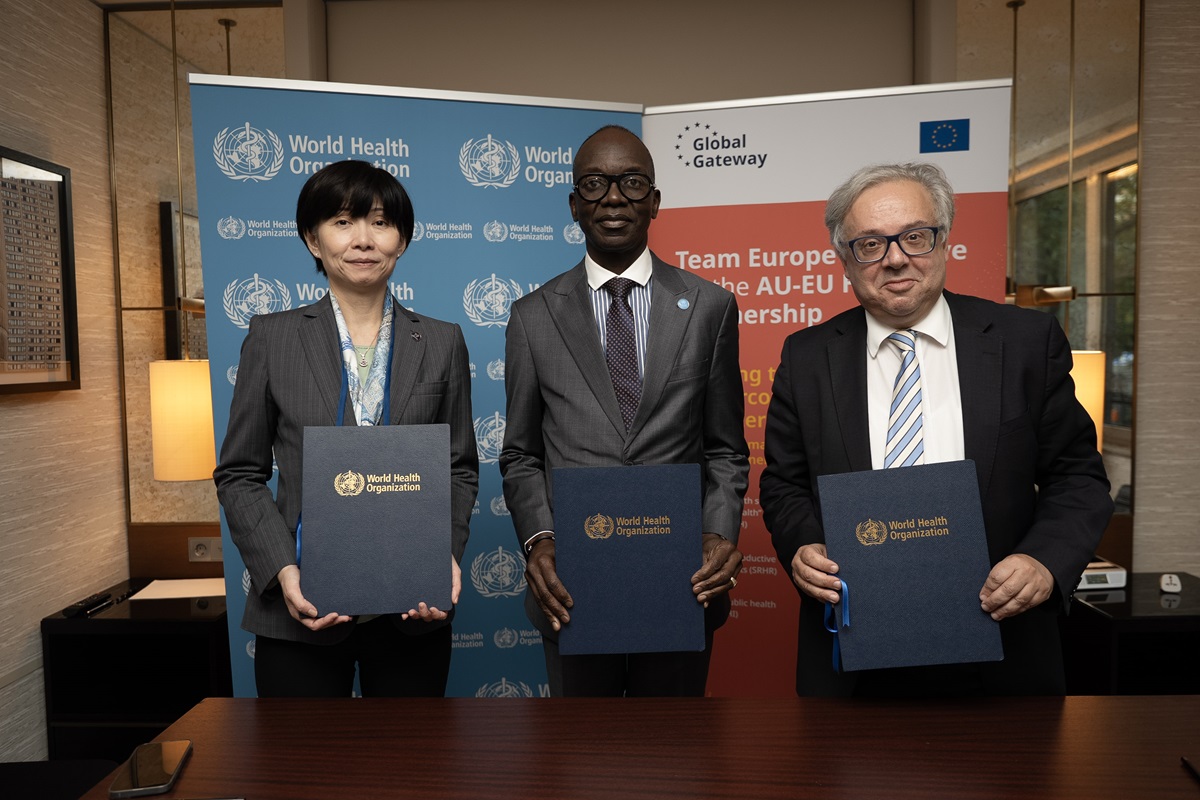
WHO and the European Union launch collaboration to advance digitized health systems in sub-Saharan Africa
The World Health Organization (WHO) and the European Union (EU) announced today a new agreement to support the digital transformation of health systems and wider adoption of WHO’s Global Digital Health Certification Network (GDHCN) in sub-Saharan Africa. This EU–WHO partnership will improve pandemic preparedness and accelerate progress towards better health and well-being for all.
The agreement was announced at the World Health Summit 2025 by Dr Yukiko Nakatani, WHO Assistant Director-General for Health Systems, Access and Data; Dr Mohamed Yakub Janabi, WHO Regional Director for Africa; and Mr Martin Seychell, Deputy Director-General of the European Commission Directorate-General for International Partnerships.
The GDHCN is a global system that enables countries to securely and reliably verify nationally approved digital health credentials across borders. The system builds on the European Union Digital COVID Certificate (EU DCC), which facilitated verification of vaccination, testing and recovery certification for international travelers connecting 76 countries and territories. However, only four countries from the WHO African Region—Benin, Cabo Verde, Seychelles and Togo—were able to join the EU DCC network.
Since its transfer to the WHO in 2023, the GDHCN has shown strong potential to support the digitization of the International Certificate of Vaccination or Prophylaxis (ICVP), commonly known as the Yellow Card, in alignment with the updated International Health Regulations (IHR). Making the most of its potential could enhance global vaccination tracking, reduce fraud, and simplify international health requirements.
Under the new joint agreement, which includes an €8 million EU grant spanning 2025 to 2028, WHO and the European Union will collaborate to bolster national efforts to advance the digital transformation of health systems in sub-Saharan Africa. WHO will provide technical and policy expertise, in collaboration with regional partners such as the Africa Centres for Disease Control and Prevention (Africa CDC).
The EU investment is part of the Digital Health workstream of the Team Europe Initiative on the EU-AU Health Partnership, which brings together European and African stakeholders to build resilient digital health ecosystems across the continent, and aligned with the EU Global Gateway strategy.
Empowering countries and people
The GDHCN supports countries in building trusted, interoperable digital health systems that directly benefit people — providing secure, portable health records accessible wherever they travel, including during health emergencies. Personal health records are managed securely by each individual country or their health system. These records cannot be accessed by other parties, including WHO.
The network is built on internationally recognized standards for privacy, data protection, and interoperability, and participation of countries is voluntary. The network fosters cross-border collaboration among countries and partners, strengthening health security today, while laying the foundation for more resilient, person-centered health systems for future generations.
Continue Reading
-
Just a moment…
Just a moment… This request seems a bit unusual, so we need to confirm that you’re human. Please press and hold the button until it turns completely green. Thank you for your cooperation!
Continue Reading
-
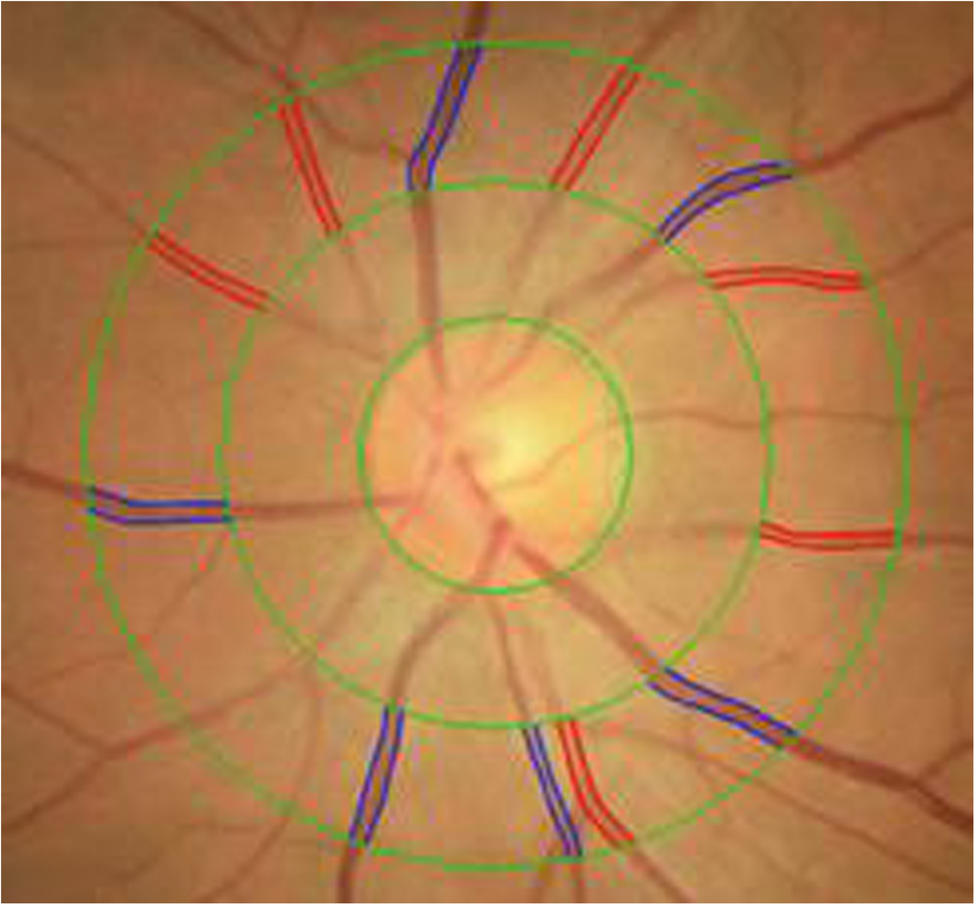
The association between retinal artery to vein ratio and fat distribution: a population-based cross-sectional study | BMC Ophthalmology
Carmeliet P. Angiogenesis in health and disease. Nat Med. 2003;9(6):653–60.
Google Scholar
Hoon M, Okawa H, Della Santina L, Wong RO. Functional architecture of the retina: development…
Continue Reading
-
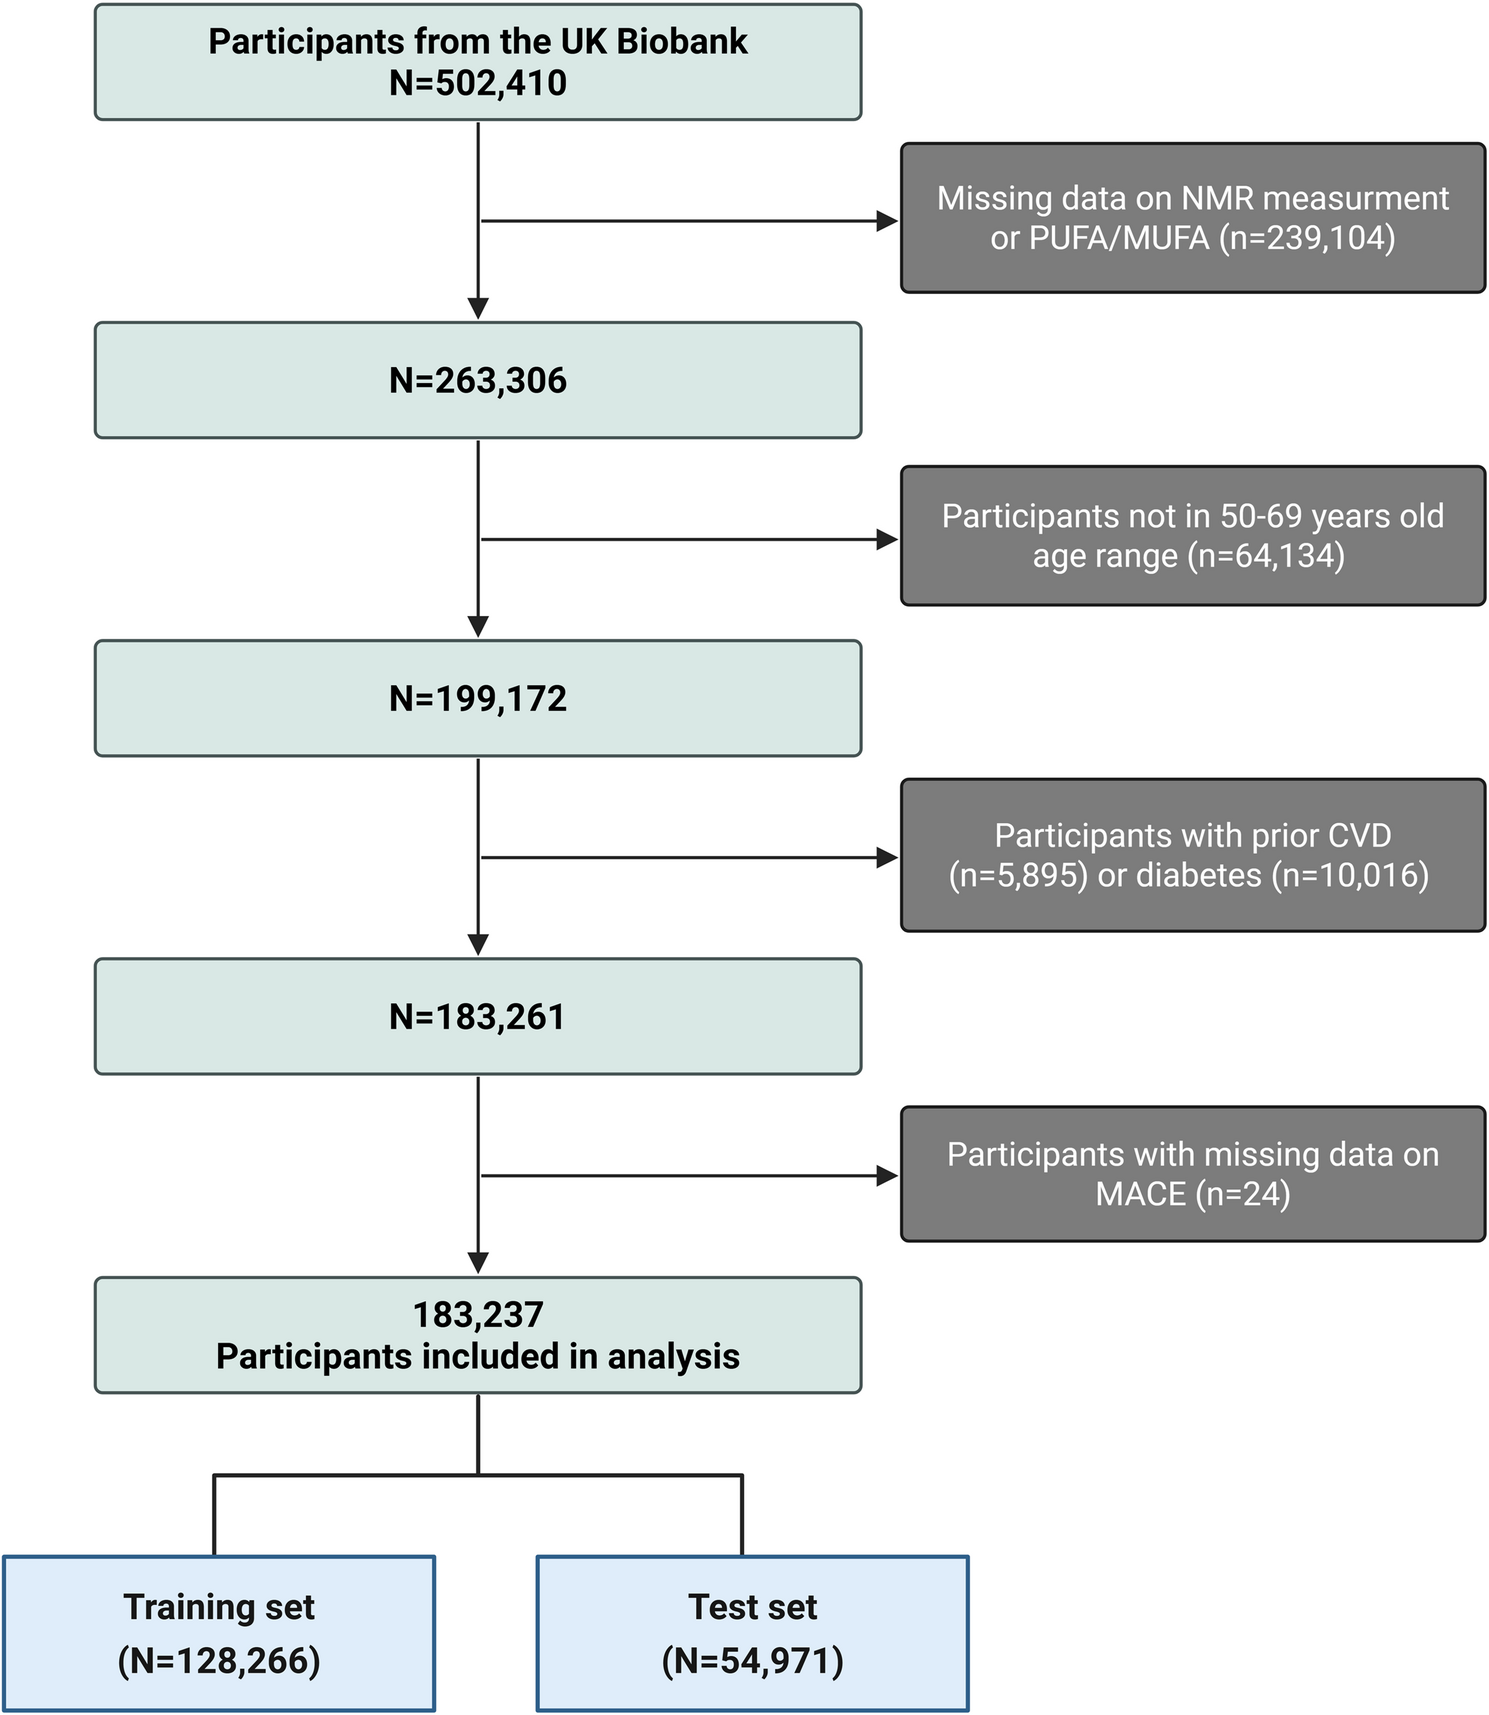
The polyunsaturated-to-monounsaturated fatty acid ratio and cardiovascular risk prediction: a prospective cohort study of 183,237 adults | Lipids in Health and Disease
Roth GA, Mensah GA, Johnson CO, Addolorato G, Ammirati E, Baddour LM, Barengo NC, Beaton AZ, Benjamin EJ, Benziger CP, et al. Global burden of cardiovascular diseases and risk factors, 1990–2019: update from the GBD 2019 study. J Am Coll…
Continue Reading
-
Machine learning models for the prediction of COVID-19 prognosis in the primary health care setting | BMC Primary Care
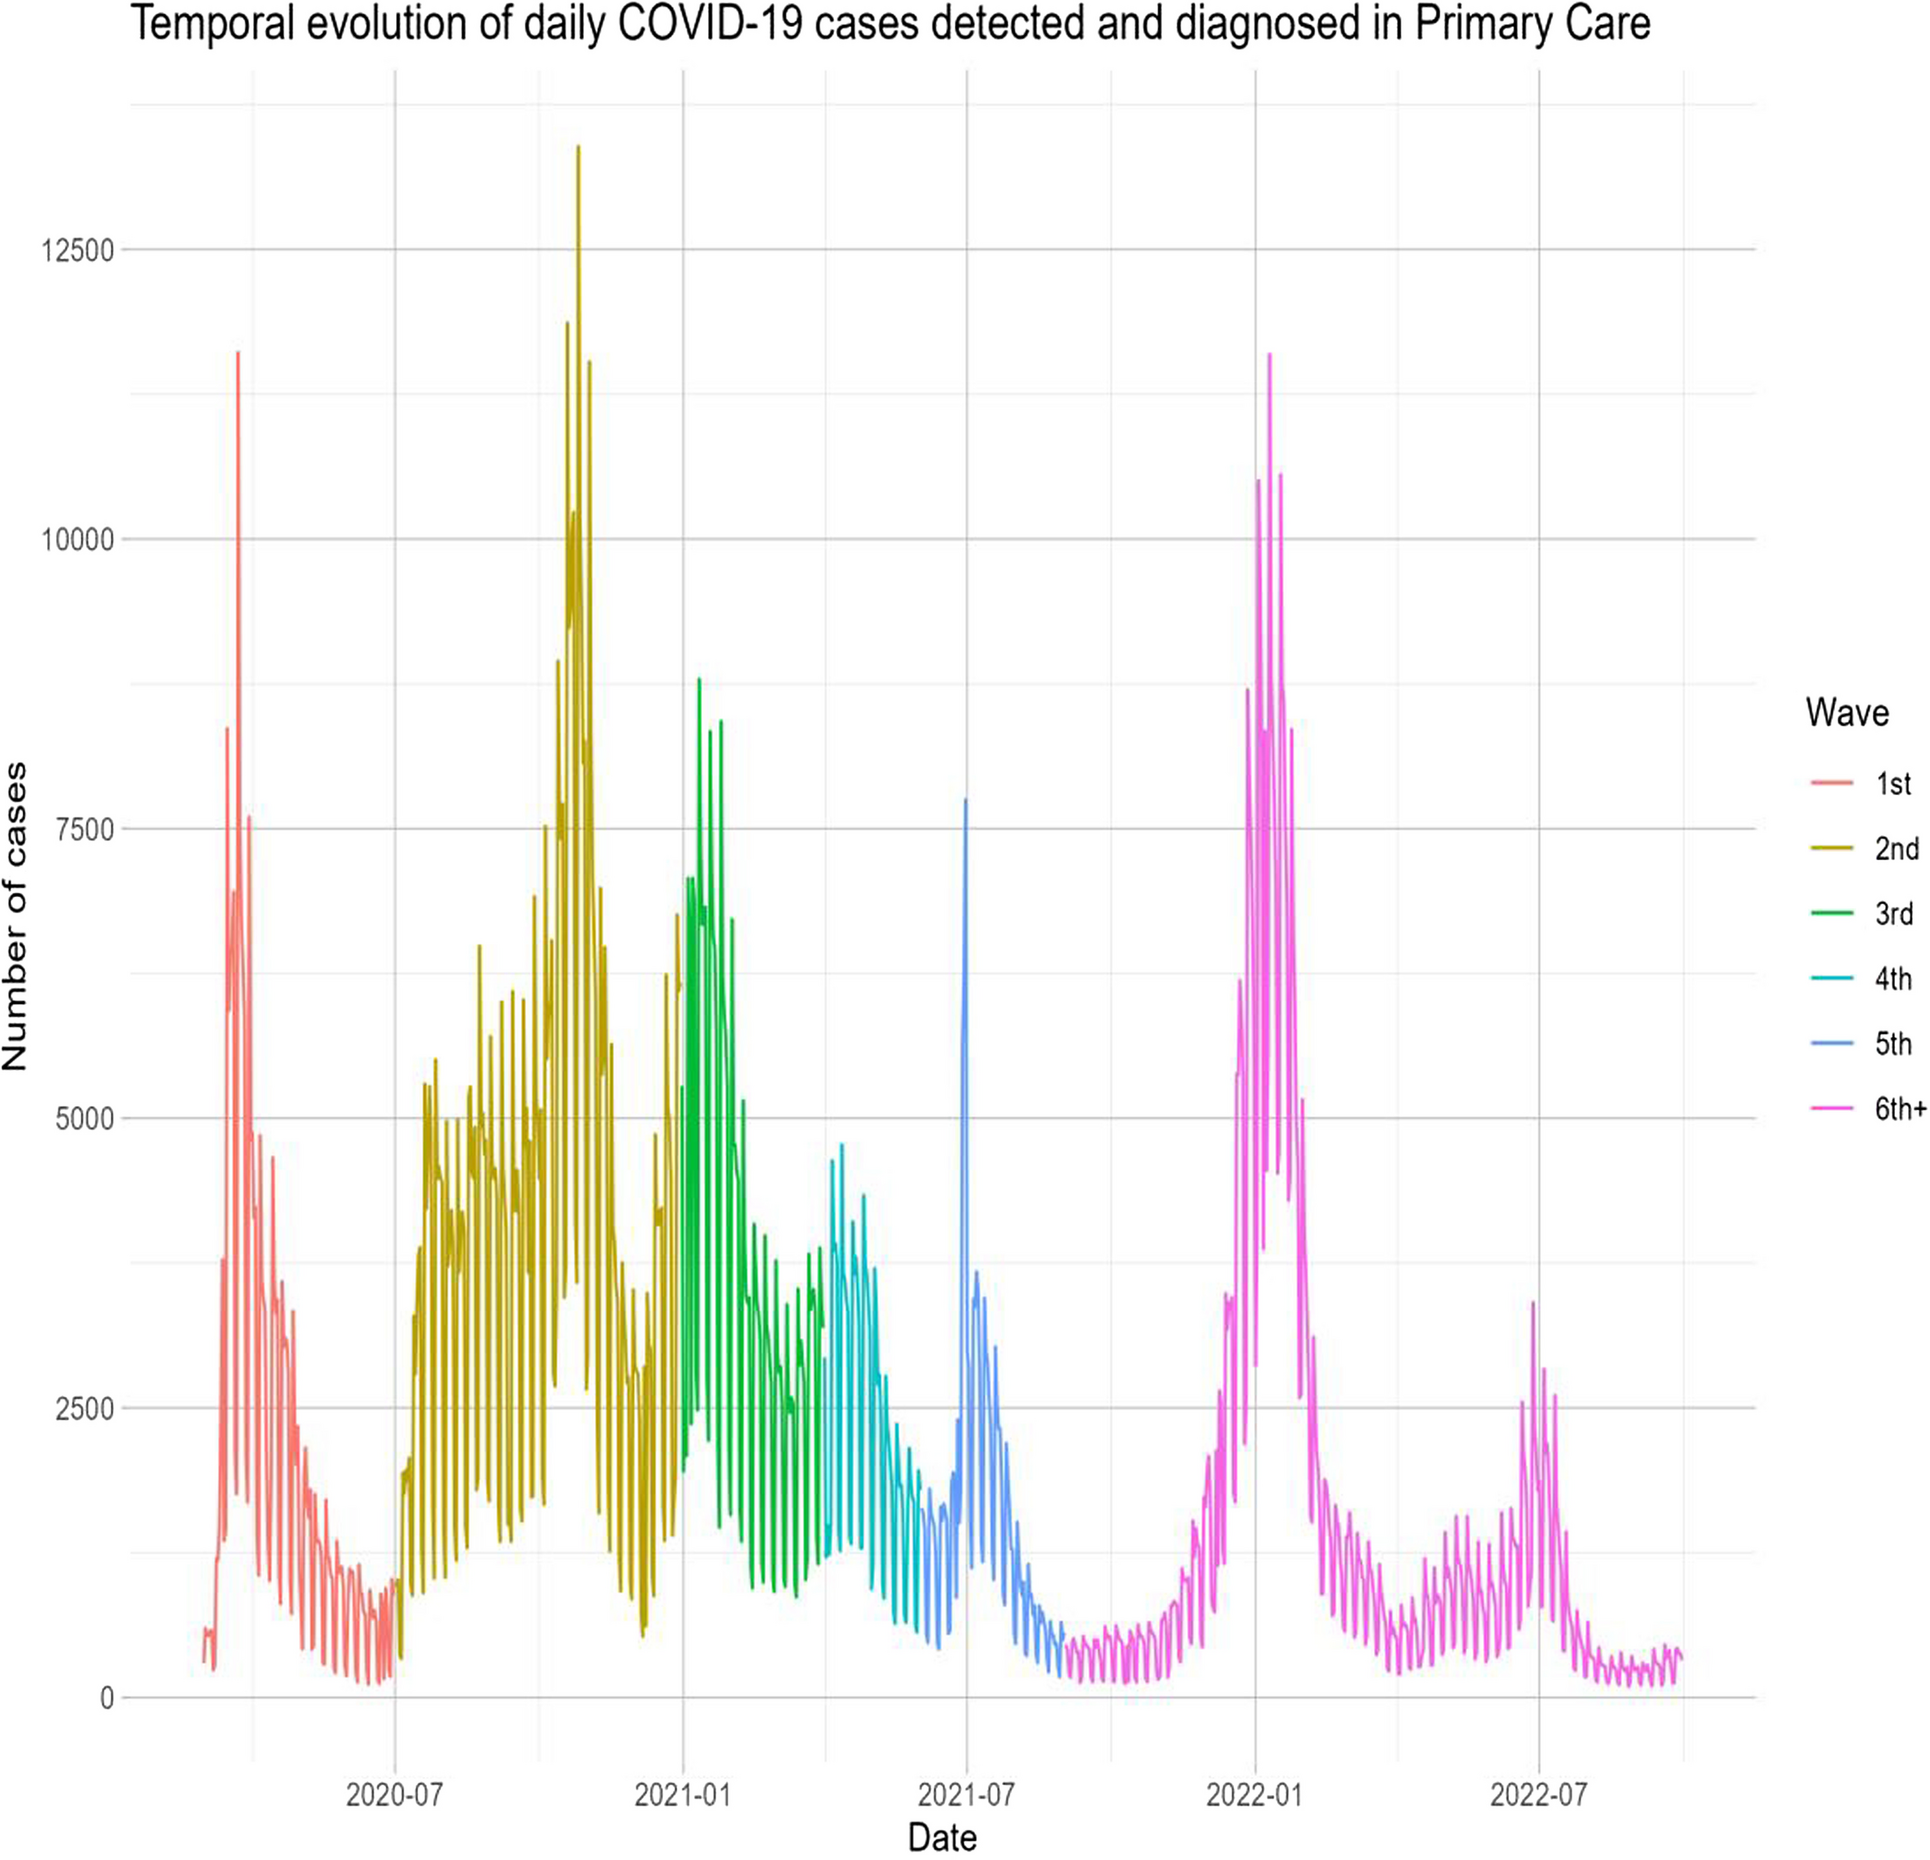
This retrospective study analyzed over 2 million COVID-19 cases from March 2020 to September 2022 across multiple COVID-19 waves, with follow-up 90 days post-diagnosis or until death. Our study underscores the significant impact of COVID-19 on PHC in the initial years of this pandemic in Catalonia. Furthermore, using machine learning models (GLMs, Lasso, Gradient Boosting, SVMs), we identified key predictors of poor outcomes, such as age, social deprivation (MEDEA), blood pressure, and a history of either diabetes, COPD, cardiovascular disease, or obesity. The models showed strong predictive accuracy (AUC: 0.73, 95%CI (0.72;0.73)–0.95, 95%CI (0.94;0.95)). Finally, using these models, an interactive web app was developed for personalized risk estimation (https://dapcat.shinyapps.io/CovidScore).
We found that the CFR was highest during the first wave of the pandemic, gradually decreasing in subsequent waves, with the second wave showing the highest incidence of cases. The higher comorbidity burden observed in the first wave may reflect limited testing availability during that period, which likely focused on more severe cases. The decrease in the CFR may be attributed to a combination of increased immunity (due to vaccination and SARS-CoV-2 infections), better identification of more severe cases, and the lower pathogenicity of recent variants like Omicron. Overall, these findings suggest changes in the SARS-CoV-2 virus, an adaptive response in healthcare, and improvements in the prevention (i.e., via vaccination) and treatment of complications as the pandemic progressed [21].
Regarding predictors of poor prognosis at the time of COVID-19 diagnosis in PHC, we identified older age, epidemic wave, social deprivation, and a history of diabetes, obesity, chronic obstructive pulmonary disease (COPD), cardiovascular disease, hypertension, and dyslipidemia. While study results vary across different populations, numerous studies have identified advanced age and comorbidities such as hypertension, cardiovascular disease, COPD, and diabetes as predictors of increased COVID-19 severity [22,23,24]. Additionally, social deprivation indicators, such as the MEDEA index, have been associated with poorer outcomes in terms of severity and mortality, underscoring the multifactorial nature of COVID-19 outcomes. Understanding and addressing these predictive factors is crucial for improving management and outcomes in affected patients. The inclusion of’epidemic wave’reflects the changing contextual factors, such as virus variants, public health measures, and healthcare strain that significantly influenced outcomes [25]. However, this limits the direct application in future waves. In such cases, the most recent wave may be used as an initial reference, while outcome data are monitored to reassess and recalibrate the model accordingly. Ideally, prediction models should be dynamically updated to remain accurate and clinically useful during future epidemic scenarios.
Conditions associated with low-grade chronic inflammation, such as obesity and diabetes mellitus, are also relevant at the metabolic level [26]. Several systematic reviews have provided consistent evidence that diabetes and obesity are associated with poorer COVID-19 outcomes, which agrees with our study [27]. Although the reasons for this association are not entirely clear, these conditions could exacerbate respiratory problems and/or affect immune responses. A systematic review and meta-analyses on high-risk phenotypes in people with diabetes determined that individuals with a more severe course of diabetes and pre-existing comorbidities had a poorer prognosis of COVID-19 than individuals with a milder course of the disease, highlighting the need for individualized and proactive management strategies for high-risk patients [28].
At the hospital level, predictive models like the ISARIC 4 C have been developed to anticipate clinical deterioration (including mortality, ICU admission, or intubation), assessing age, gender, comorbidities, and nosocomial infection [29]. A similar study in the United Kingdom, utilizing computerized PHC medical records, developed predictive algorithms for COVID-19 mortality and hospital admission risk. Factors such as age, body weight, ethnicity, and social risk explained 73% of COVID-19 deaths and 58% of hospital admissions, suggesting periodic recalibration of these models to reflect the evolving nature of the pandemic [30]. An early pandemic study on PHC identified key risk factors for ICU admission and mortality, including advanced age, male gender, autoimmune disease, bilateral pulmonary infiltrates, and elevated LDH, D-dimer, and C-reactive protein. Protective factors included myalgias, arthralgias, and anosmia [31].
Recent advances in AI and machine learning have significantly contributed to managing the COVID-19 pandemic by aiding in detection, treatment, mortality prediction, and infection modeling to reduce virus spread [32,33,34].
In this study, we used machine learning to develop predictive models and then used these models to develop an app. The app provides comprehensive information to estimate the risk of COVID-19 prognosis outcomes for individuals based on their risk factors (e.g., age, sex, comorbidities, vaccination status, COVID-19 wave). This approach could be used in PHC to identify individuals needing closer monitoring and interventions to prevent serious complications and hospitalization. Moreover, model calibration was assessed using the Brier Score, which integrates both discrimination and calibration aspects. All models showed low Brier Scores, suggesting a high level of agreement between predicted and observed risks. Given the large, representative nature of the dataset, we expect limited calibration drift within this population. Nonetheless, we acknowledge that external validation with calibration plots and slope/intercept assessment would be useful to confirm generalizability in other settings. Although COVID-19 is now endemic, this study highlights the importance of early risk stratification in primary care based on routine data at diagnosis. These findings may inform preparedness for future COVID-19 waves or other infectious outbreaks, where identifying predictors of poor outcomes at diagnosis remains key to guiding timely care.
Our study has limitations inherent to its retrospective design. Outcomes depend on the quality of existing clinical records not specifically collected for this research and have yet to undergo individual validation. Some outcomes may have been underreported or misclassified, especially if they were managed outside the hospital setting or not fully captured in the electronic health records. However, major outcomes such as mortality, hospitalization, and ICU admission are reliably recorded within the system. A notable limitation is the potential impact of vaccine implementation on epidemiology and prognosis, which underscores the need to recalibrate predictive models with post-vaccination data to maintain accuracy. Periodic updates with the latest available data are essential to ensure the continued relevance of these models. Although no predictive model is perfect for COVID-19 patients, our models serve as valuable tools to estimate the risk of complications, helping to identify patients who require closer monitoring. However, the accuracy of these models can be affected by variations in the detection and recording of symptoms and risk factors by different healthcare professionals. Moreover, mild COVID-19 cases may have gone unrecorded in PHC, potentially leading to their exclusion from our study population. Another limitation of our study is that the model was developed using subjects with confirmed COVID-19, whereas in primary care, clinicians often assess patients with suspected infection before test confirmation. This may limit applicability in early diagnostic uncertainty. Moreover, the model remains useful for risk stratification once a diagnosis is confirmed in the primary care setting. Additionally, the study benefits from using the SIDIAP database, which includes a substantial patient cohort and is a well-validated source for epidemiological and pharmaco-epidemiological studies within the Catalan primary care setting. This database not only provides standardized clinical data (including health issues, physical exams, lab results, and medication records) from pseudo-anonymized electronic health records but was also specifically updated to include COVID-19-related variables (such as diagnostic tests and procedures), enabling researchers to conduct targeted epidemiological studies. Despite the fact that we used a large, representative dataset and validated the models on a separate 25% test set, external validation was not performed. This may lead to overestimation of performance. External validation using more recent data or in other populations, such as from different regions, healthcare systems, or countries is needed to confirm the model’s generalizability and ensure robust performance of the predictive models across evolving clinical contexts.
Continue Reading
-

Jimmy Fallon and Bozoma Saint John on What It Takes for People, Products, and Brands to Break Through
ALISON BEARD: I’m Alison Beard.
ADI IGNATIUS: I’m Adi Ignatius. This is HBR IdeaCast.
ALISON BEARD: Adi, you are very familiar with both of the guests on today’s show. One is a comedian and talk show host, Jimmy…
Continue Reading
-

Smoking Tied to Faster Huntington’s Decline – European Medical Journal Smoking Tied to Faster Huntington’s Decline
Why This Matters for Clinical Practice
HUNTINGTON’S disease is progressive and incurable, so modifiable factors that influence symptom onset and progression are clinically relevant. Using Periodic Dataset 4 from Enroll-HD, investigators…
Continue Reading
-
CLE14 peptide delays broccoli senescence by regulating chlorophyll metabolism and reactive oxygen species homeostasis | BMC Plant Biology
Plant materials and treatments
Broccoli (Brassica oleracea L. var. Italica) was collected from Shulan Agricultueal Farm in Hangzhou, Zhejiang Province. ‘Naihanyouxiu’ broccoli cultivar was used as plant material in the study, which was provided from Sakata Seed Corporation. And the broccoli was harvested at commercial maturity, characterized by tightly closed florets and a deep green color. For this experiment, broccoli of the same size, consistent color, and no mechanical damage were selected.
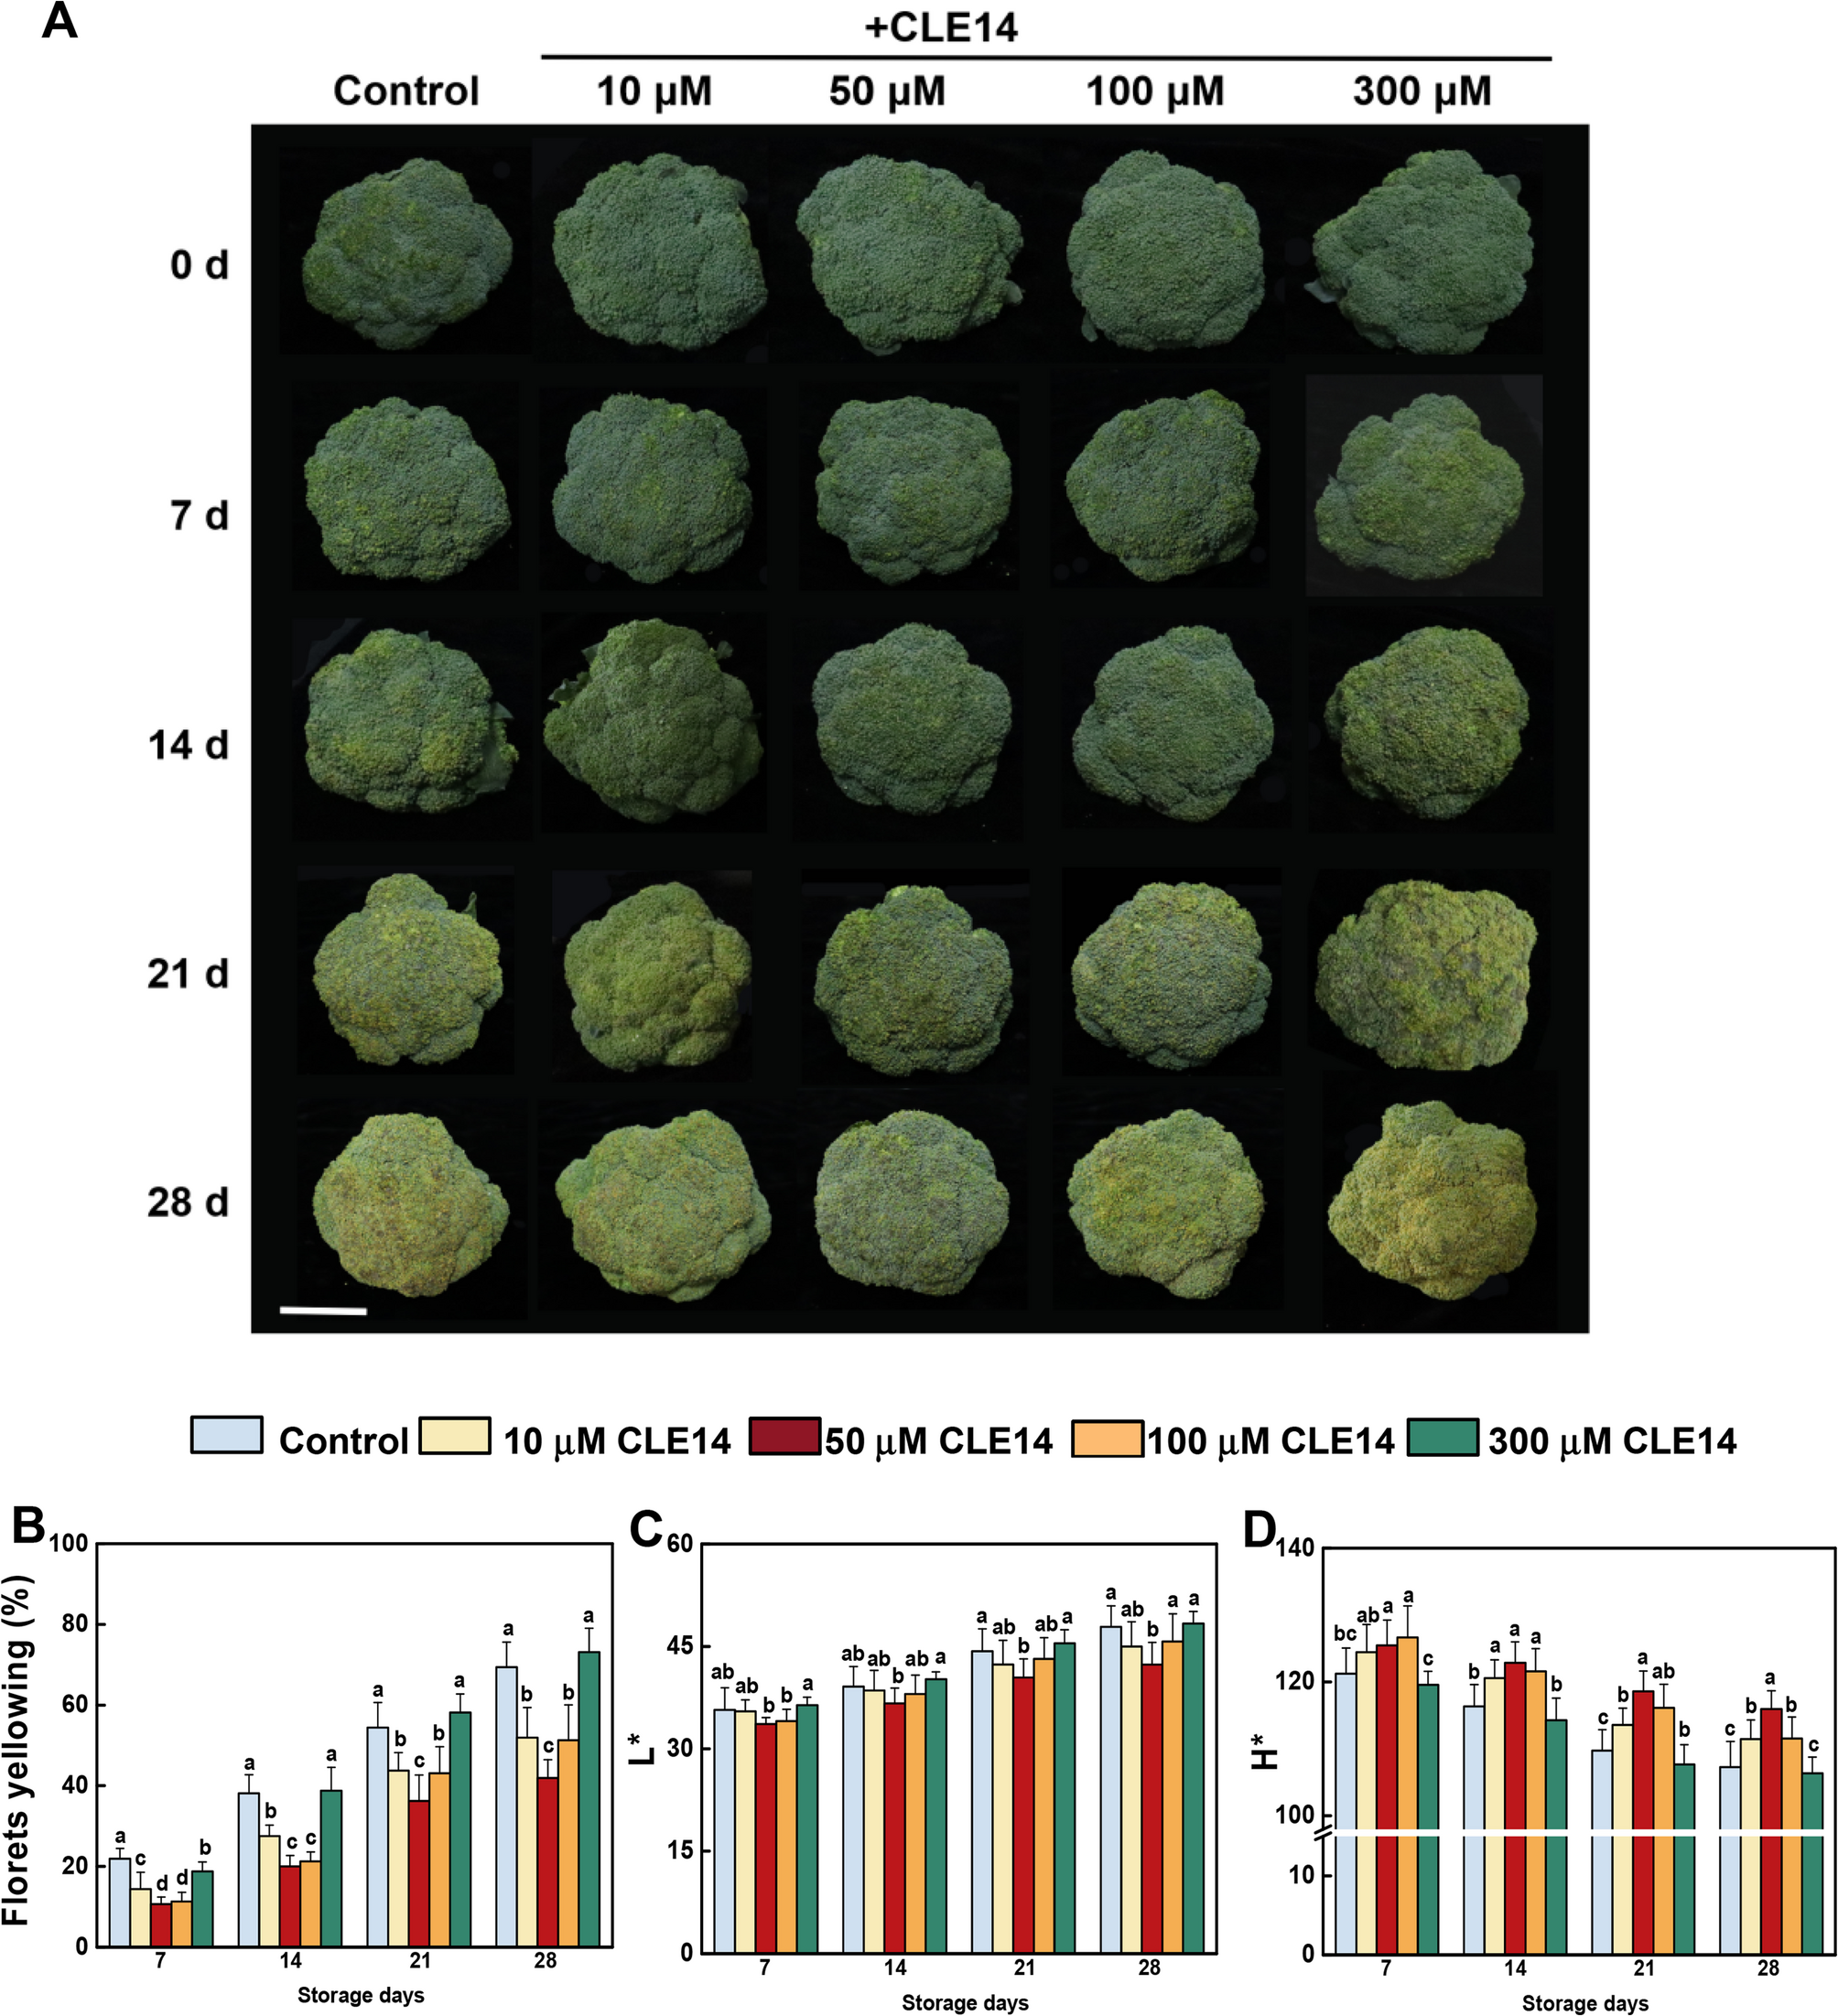
The CLE14 peptide was synthesized by Dongheng Biomedical Co., Ltd., China. A total of 300 broccoli heads were randomly assigned to 5 groups containing 60 broccoli heads each (three replicates, 20 broccoli heads per replicate) for the experimental treatments, and sprayed with 0 (control), 10, 50, 100 or 300 µM CLE14, respectively. After being dried overnight, the treated broccoli was packaged and stored at 4 ± 0.5℃ for 28 days. The appearance attributes were evaluated every 7 days. After each evaluation, the florets from the five broccoli groups were collected for subsequent gene expression and biochemical analyses.
Broccoli yellowing index and color detection
The broccoli yellowing index (%) was used to assess the yellowing area of broccoli surfaces using the scale described by Luo et al. [22]. The color parameters of broccoli were valued using a digital colorimeter (CR-400, Konica Minolta, Japan). The values of lightness (L*) and hue angle (H*) were measured at five points on each broccoli every 7 days.
Measurement of nutritional quality of broccoli
The soluble sugar content of broccoli was determined using a commercial assay kit (BC0030, Solarbio, China).
The soluble protein content in broccoli was measured using a BCA protein assay kit (ml095490, Shanghai Enzyme-linked Biotechnology, China). The intracellular proteins in broccoli were extracted using PBS buffer (50 mM, pH 7.4), and the soluble protein content was calculated by measuring the absorbance at 760 nm using BSA as a standard.
Broccoli endogenous Vitamin C content was detected using the solid blue salt colorimetric method descripted by Zhang and Huang [23]. Vitamin C content was calculated by measuring the absorbance at 420 nm.
Glucosinolate levels were quantified using a glucosinolate assay kit (ml092776, Shanghai Enzyme-Linked Biotechnology). Total glucosinolate content was determined by measuring the absorbance at 505 nm.
The phenolic and flavonoid contents were measured using the Folin-Ciocalteu method and NaNO2-Al(NO3)3-NaOH colorimetry method, respectively. First, broccoli samples (0.5 g) were mixed with 5 mL of methanol (80%) and subjected to ultrasonic treatment for 30 min. Supernatants were then collected for analysis. For phenolic content measurement, 200 µL of the supernatant was combined with 1 mL Folin-Ciocalteau and 800 µL Na2CO3 solution (75 g L−1), and the mixture was incubated at 25℃ for 1 h. The absorbance was then measured at 765 nm. For the total flavonoid content test, 1 mL of the supernatant was mixed with 1 mL 70% ethanol and 0.3 mL of 5% NaNO2. After mixing, 0.3 mL 10% Al(NO3)3 was added and the mixture was left to stand for 3 min at 25℃, 1 mL NaOH (1 mol L−1) was then added. The reaction mixture was detected at 510 nm after 10 min using rutin as a standard.
Chlorophyll content
The chlorophyll content was assessed following the method described by Xu et al. [24]. Approximately 100 mg of broccoli powder was added to 5 mL of acetone/ethanol (2:1) solution. Chlorophyll content was analyzed based on absorbance at 664 nm and 645 nm.
RNA extraction and quantitative PCR analysis
Total RNA was extracted from broccoli florets using an RNA Simple Total RNA Kit (Tiangen, China) with DNase I treatment. A ReverTra Ace quantitative (qPCR) reverse transcription (RT) kit (Toyobo, Japan) was used to synthesize cDNA. qRT-PCR assays were performed using the StepOne detection system (Thermo Fisher Scientific, USA) and SYBR Green PCR Master Mix Kit (Takara, Japan). Gene expression levels were calculated using the comparative ΔΔCt method. Briefly, the average Ct value for the target gene was normalized to the average Ct value of the endogenous reference gene (BoActin) to obtain the ΔCt value for each sample: ΔCt = Ct (target gene) – Ct (reference gene). The ΔΔCt value was then calculated as: ΔΔCt = ΔCt (test sample) – ΔCt (untreated sample). The relative fold change in gene expression was determined as 2^(-ΔΔCt). Three independent biological replicates were analyzed per experimental group. Sequences of primers are listed in Table S1.
RNA-seq analysis
Three independent repeats from the control and CLE14-treated broccoli at 0, 7, 14, 21, and 28 d post-harvest were used for RNA-seq analysis. RNA was extracted using the RNAprep Pure Plant Kit (Tiangen, China) and quantified using a NanoDrop 2000 spectrophotometer (Thermo Fisher Scientific). RNA integrity was determined using the RNA Nano 6000 Assay Kit of the Agilent Bioanalyzer 2100 system. Biomarker Technologies (Beijing, China) prepared Illumina libraries and sequenced them on an Illumina NovaSeq 6000 sequence platform (150 bases paired-end reads; Illumina, USA). The raw reads were further processed using the bioinformatics pipeline tool, and the BMKCloud (www.biocloud.net) online platform. Raw reads in fastq format were first processed through in-house Perl scripts, and the reads containing adapter or poly-N and low-quality reads were removed to obtain clean reads for further analyses. The proportion of clean reads in the samples (Q30) ranged from 94.62 to 97.82%. The cleaned reads were aligned to the Brassica oleracea reference genome from NCBI using hisat2 tools soft with default parameters. Gene expression levels were quantified by mapping fragments per kilobase of transcript per million fragments mapped (FPKM). Additional, differential expression analysis between treatments were performed using the DESeq2 package, and the genes with an adjusted P-value < 0.01 & Fold Change ≥ 2 were assigned as differentially expressed. Randomly chosen deferentially expressed genes were verified using qRT-PCR. The weighted gene co-expression network analysis (WGCNA) (min Module Size 30, and merge Cut Height, 0.25) was used to build a co-expression network. Data were analyzed using the online BMKCloud bioinformatics platform.
Malondialdehyde (MDA), H2O2 content and O2
•− production rateThe MDA levels were measured following Xu et al. [24]. Broccoli floret powder was mixed with 5 mL trichloroacetic acid, and the supernatant was collected via centrifugation. The supernatant was combined with 2 mL of thiobarbituric acid (0.67%) and boiled for 20 min. The MDA content was analyzed by measuring the absorbance at 450, 532, and 600 nm.
H2O2 content was measured using a Micro Hydrogen Peroxide (H2O2) Assay Kit (BC3590, Solarbio, China).
The generation rate of superoxide anions (O2•−) was determined using hydroxylamine oxidization according to Shi et al. [25]. Briefly, broccoli (0.5 g) was mixed with 2 mL of PBS buffer, and the supernatant was collected. The supernatant was mixed with 100 µL NH2OH·HCl (1 mM), 1 mL PBS buffer and subjected to incubation at 25℃ for 1 h. Following this, 1 mL C6H7NO3S (17 mM) and 1 mL C10H7NH2 (7 mM) were added. The generation rate of O2•− was calculated based on absorbance at 530 nm after incubation at 25℃ for 20 min, using NaNO2 as the standard.
Enzyme activities
The activities of pheophorbide a oxygenase (PAO) and pheophytinase (PPH) were measured using Plant enzyme activity Kits (Enzyme-linked Biotechnology).
Catalase (CAT) and superoxide dismutase (SOD) activity was measured as described by Cheng et al. [26]. Broccoli floret powder (0.5 g) was added to 3 mL of PBS buffer (50 mM, pH 7.8, with 0.2 mM EDTA, 2mM AsA, 25 mM HEPES, and 2% polyvinylpolypyrrolidone [w/v]). The supernatant was then collected for enzyme activity assay, which was performed using a SHIMADZU UV-2600 spectrophotometer (Shimadzu, Kyoto, Japan).
Statistical analysis
All data were analyzed using Statistical Analysis System version 8 (SAS Institute Inc., Cary, NC, USA). The significance of treatment differences was analyzed using ANOVA followed by Tukey’s test at the 5% significance level. Data were recorded as the mean ± standard errors (SE) of at least three independent biological replicates.
Continue Reading